The forest lends itself as a metaphor for talking about big data. We are interested in the forest because of the amount of trees there are. We enjoy their view, their rustling, the multitude of trunks, fruits, plants. Apart from the forest rangers, few visitors have knowledge of individual trees in the forest, unless they fall outside ‘normality’. Particularly old, thick, large trees, rare specimens can sometimes catch our attention. But the large part of the trees is only interesting for us as a group.
In the same way, companies look at us, users of their technology. When they make up profiles based on our clicks, likes and comments, their focus is not our individual personality, but what we have in common with others, our relationships, our existence in group(s).
Trees are also interconnected via underground networks of mycelium, a phenomenon that covers our entire globe and is referred to as ‘the woodwide web’. Therefore it is tempting to start organising small algorithmic games in the forest based on algorithms used in predictive models.
A first game is an interpretation of the ‘linear regression’. Next to finding a correlation – however subjective, statistically irresponsable and minimal the measurements may be – this exercise also shows the negotiations and compromises that you go through along the way to arrive at usable and measurable data. It is also a very nice way to look at trees in detail.
Linear Regression
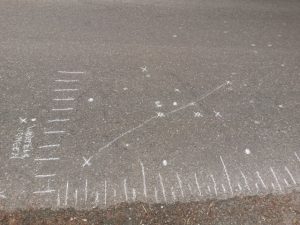
Graph of the linear regression game with Natuurgroepering Zoniënwoud (http://www.ngz.be/), Overijse, June 2017
In statistics, linear regression is is a statistical method that allows us to summarize and study relationships between two continuous (quantitative) variables:
– One variable, denoted x, is regarded as the predictor, explanatory, or independent variable.
– The other variable, denoted y, is regarded as the response, outcome, or dependent variable.
Linear regression was the first type of regression analysis to be studied rigorously, and to be used extensively in practical applications.
The following videos by David Longstreet explain simple linear regression very well:
– Introduction to Linear Regression
– Calculating Linear Regression using least square method
– Calculating R Squared Using Regression Analysis
A History of Linear Regression
Francis Galton, a cousin of Charles Darwin and an accomplished 19th century scientist in his own right, has often been criticized in this century for his promotion of “eugenics” (planned breeding of humans). While studying the problem of heredity – understanding how strongly the characteristics of one generation of living things manifested in the following generation, he was the first to define the linear regression slope.
Galton initially approached this problem by examining characteristics of the sweet pea plant. He chose the sweet pea because that species could self-fertilize; daughter plants express genetic variations from mother plants without contribution from a second parent. This characteristic eliminated, or at least postponed, having to deal with the problem of statistically assessing genetic contributions from multiple sources.
In 1875, Galton had distributed packets of sweet pea seeds to seven friends; each friend received seeds of uniform weight (see also the original paper), but there was substantial variation across different packets. Galton’s friends harvested seeds from the new generations of plants and returned them to him. Galton plotted the weights of the daughter seeds against the weights of the mother seeds. He realized that the median weights of daughter seeds from a particular size of mother seed approximately described a straight line with positive slope less than 1.0.
Galton’s first insights about regression sprang from this two-dimensional diagram plotting the sizes of daughter peas against the sizes of mother peas. Galton used this representation of his data to illustrate basic foundations of what statisticians still call regression.
Source: https://www.tandfonline.com/doi/full/10.1080/10691898.2001.11910537
Steps in the game
Ideally the participants in this game take a sample of 100 trees. Experience shows that this requires 20 people, who measure each 10 trees, in groups of two. With previous knowledge about the species of common trees, this takes one afternoon.
First of all, the question arises of what wants to be measured. Which possible correlation do you want to investigate? During a workshop with art students from Studio Editions of the Ecole Nationale d’Arts de Paris Cergy in January 2018, one of the proposals was to find out if there was a positive relationship between the thickness of oak and the type of trees growing around an oak tree, and if there is a type of tree that is more common in growing near the oak.
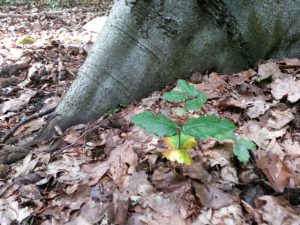
Observing the relationship between the appearance of lateral roots and the amount of one-yearly sprouts around the beech, Zoniënwoud, June 2017
Then a protocol is established for the ‘random’ choice of the trees. We make use of a dice for this. If a group throws a three, they can decide to observe the fourth tree. The question remains how the trees are counted, whether the trees to the left and/or right of the path are counted, to what distance of the path you take the trees into account and what you do with trees that grow along the path and do not allow for close neighbours because of the compaction of the soil.
During the observations of the different trees, all kinds of questions and obstacles can emerge, so that the protocol for the measurements may be adjusted along the way. There may also be cases of Omitted Variable Bias. Omitted variable bias occurs when a regression model leaves out relevant independent variables, which are known as confounding variables. They are also called spurious effects, and spurious relationships. The problem is very well explained in a post by Jim Frost. And if you want to have fun, have a look at some Spurious Correlations by Tyler Vigen.
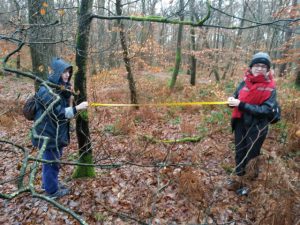
Linear regression game with art students of Studio Editions of the Ecole Nationale d’Arts de Paris Cergy, Fontainebleau, January 2018
Finally, the measurements are logged in a graph. Organizing the information is again a small performative moment, with as result a first idea whether or not there is a possible correlation.
If there is time left, the PM Coefficient can be calculated to check the accuracy of the correlation.

Composing a graph on the train back, art students of Studio Editions of the Ecole Nationale d’Arts de Paris Cergy, Fontainebleau, January 2018
Participants in the game
A big thank you to: Anne-Laure Buisson, Chris Vanderlinden, Angeline Ostinelli, Temperance Cole, Amo Vaccaria, Doriane Geneste, Julie Timoshkin, Lu Wang, Rachel Lang, Rudy Levassor, Nicolao Federico.
Leave a Reply
You must be logged in to post a comment.